ClinicalTrials.gov keeps every version of every trial record, and has for years. Any study page has a Record History tab where you can select two versions and see exactly what changed between them, including an option to show only the modules that changed. We should have checked this before publishing, and we did not.
What this post gets right is narrower than what it originally claimed. Reading that history means opening one trial at a time, and there is no way on ClinicalTrials.gov to watch a set of sponsors or diseases and be told when something in that set moves. That is the gap Trials at Risk fills. The figures below are unchanged.
ClinicalTrials.gov keeps every version of every trial record, and its Record History tab will show you exactly what changed between any two of them. What it will not do is watch a portfolio for you. To catch a primary completion date moving out by two years, you have to already suspect that trial and go open it.
DataLookout has been taking a full daily snapshot of every trial we track since March. That history is what makes our newest feature possible. Trials at Risk surfaces a sponsor's active trials that are showing warning signs, with the before-and-after behind each one.
What the scan found
Across the active trials we track, here is what was showing at-risk signals as of June 5, 2026:
Those 2,443 trials span 1,159 distinct lead sponsors — this is not a handful of outliers. 152 trials are showing more than one signal at the same time, and 289 have had their completion date pushed out by more than a full year. Every trial here is active (recruiting, active and not recruiting, not yet recruiting, or enrolling by invitation). Finished trials are never counted.
The three signals
Trials at Risk watches for three specific, observable changes — all drawn from the trial's own record, not from any prediction or model:
Completion date pushed out
The primary completion date moved later by 30 days or more. The flagship delay signal — a program is taking longer than the sponsor last told the registry.
Enrollment cut
The enrollment target was revised downward. Often the first quiet sign a study is being scaled back or restructured.
Endpoint changed
A primary endpoint was modified. A change to what the trial is measuring — material context for anyone reading the eventual readout.
Each at-risk trial is ranked by the severity of its recent changes over a 90-day window, so a study that pushed its date by two years and cut enrollment surfaces above one with a single minor edit.
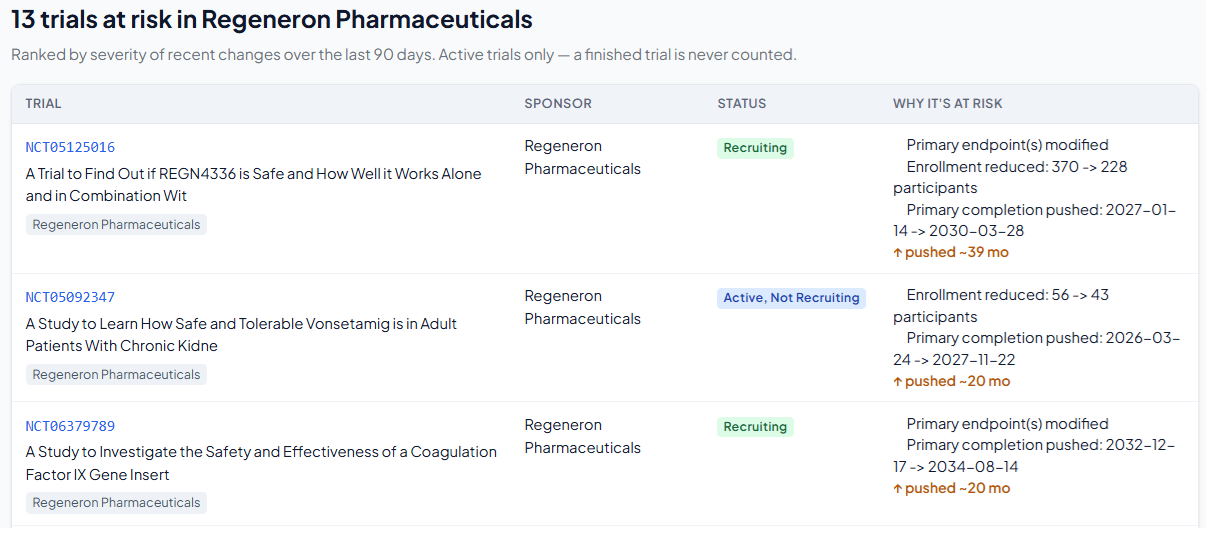
What it looks like on real trials
Here's the actual Trials at Risk view for one sponsor — Regeneron — with the exact changes as recorded on ClinicalTrials.gov:
Who it's for
- BD and competitive intelligence teams watching a competitor's pipeline — a slipping Phase 3 completion date changes when a readout (and a potential market entry) is likely to land.
- Biotech investors tracking specific assets — a quiet enrollment cut or endpoint change is the kind of detail that rarely makes it into a press release.
- Clinical operations teams benchmarking against competitive trials in the same indication.
Where to find it
Trials at Risk is live in the dashboard now. Pick a sponsor you follow, and the page surfaces that sponsor's at-risk trials, ranked by severity. Free accounts see a preview; the full list — every at-risk trial with the before-and-after behind each one — is included on the paid plans ($49 and $149 per month). As always, the underlying data is ClinicalTrials.gov, updated daily.
See which of your watched trials are at risk
Pick a sponsor and surface its trials showing warning signs, ranked by severity.
Get Started FreeExternal sources cited: None — all data is drawn directly from ClinicalTrials.gov trial records.